KRACK Attack – Internet Panics Over Big Wi-Fi Flaws in WPA2 Security

Bad news for WiFi wireless networks everywhere has been revealed by security researchers. Several key management vulnerabilities have been found in the 4-way handshake of the WPA2 security protocol, which helps to keep modern Wireless Local Area Networks (WLAN) secure via encryption, 

Everyone has hopefully ensured now that their home wireless network and devices are all connected using the latest Wi-Fi Protected Access II (WPA2) method of encryption, which has so far served us all well. The bad news is that a string of new vulnerabilities have been discovered that could result in WPA2 secured networks being decrypted, hijacked and generally abused (it works against both WPA1 and WPA2 – personal and enterprise networks – and against any cipher suite being used like WPA-TKIP, AES-CCMP and GCMP).

As the US Computer Emergency Readiness Team (US-CERT) states, “The impact of exploiting these vulnerabilities includes decryption, packet replay, TCP connection hijacking, HTTP content injection, and others. Note that as protocol-level issues, most or all correct implementations of the standard will be affected.”

The details of all this are due to be published shortly via several vulnerability announcements (CVE-2017-13077, 13078, 13079, 13080, 13081, 13082, 13084, 13086, 13087, 13088) and the collection of flaws are being referred to as KRACK (aka – Key Reinstallation Attacks). Researchers have set up a dedicated website to provide information on the incoming problem – https://www.krackattacks.com.

Statement by the Researchers

We discovered serious weaknesses in WPA2, a protocol that secures all modern protected Wi-Fi networks. An attacker within range of a victim can exploit these weaknesses using key reinstallation attacks (KRACKs). Concretely, attackers can use this novel attack technique to read information that was previously assumed to be safely encrypted. This can be abused to steal sensitive information such as credit card numbers, passwords, chat messages, emails, photos, and so on.

The attack works against all modern protected Wi-Fi networks. Depending on the network configuration, it is also possible to inject and manipulate data. For example, an attacker might be able to inject ransomware or other malware into websites.

The weaknesses are in the Wi-Fi standard itself, and not in individual products or implementations. Therefore, any correct implementation of WPA2 is likely affected.

So, are we all doomed? Well.. yes and no. Certainly if you read a lot of the media coverage then you’d be forgiven for thinking that the sky was about to fall and hackers are due to break into all your home networks and / or devices. KRACK is certainly no laughing matter and it is indeed a very a serious problem, although it’s important to put these things into some common sense perspective.

The detailed research paper on KRACK  covers what appears to be quite a complex method of breaking through WPA2 and it’s one that, due to some flaky implementation of WiFi standards (802.11), won’t work effectively (yet) on Microsoft Windows or Apple iOS machines / devices. Most of the problem resides with Android based Smartphone and Tablets, where the paper largely focused.

On top of that there’s currently no known public attack code available to exploit the vulnerabilities, although that will no doubt change. Any hacker would need to be both very skilled and also situated in close proximity to your network kit in order to conduct the attack.

The industry doesn’t need to create WPA3 in order to tackle the problem because WPA2 is patchable, which is the good news. The bad news is that some broadband routers and other software or device manufacturers, as well as many users themselves, can be quite poor when it comes to keeping their systems up-to-date. Suffice to say, keep an eye out for the latest patches and deploy them.

One other thing to note is that the main attack is against the 4-way handshake, and does not exploit access points, but instead targets clients. “So it might be that your router does not require security updates. We strongly advise you to contact your vendor for more details. In general though, you can try to mitigate attacks against routers and access points by disabling client functionality (which is for example used in repeater modes) and disabling 802.11r (fast roaming). For ordinary home users, your priority should be updating clients such as laptops and smartphones,” said the researchers.

The researchers are now moving on to ponder whether other protocol implementations are also vulnerable to key reinstallation attacks. Protocols that appear particularly vulnerable are those that must take into account that messages may be lost. “After all, these protocols are explicitly designed to process retransmitted frames, and are possibly reinstalling keys while doing so,” said the team.


Contact us: London 0203 322 2443 | Cardiff: 02920 676 712 | Winchester: 01962 657 390 |  [email protected]
 

www.ispreview.co.uk/index.php/2017/10/krack-attack-internet-panics-big-wi-fi-flaws-wpa2-security.html

4 Different Site Surveys That Will Improve Your Wireless Network

We’ve had a few recent requests for this, so we thought it was the perfect topic for our blog this week!

Site Surveys are kind of like all the ways you can cook shrimp. You know, like in that scene in Forest Gump when “Bubba” goes on and on about the many different ways you can cook them?

Whilst there aren’t quite as many as Bubba rattled off, there are quite a few and they all have their specific place in the wireless network design process.

Before we get into the various site-survey types, it’s important to mention that site-surveys are not the design process but merely a component in the process.

Here are the many faces of a site-survey; what they are for and when they should be used.

1 – Predictive Site Survey

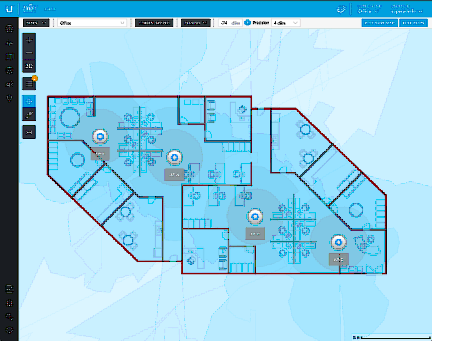
This type of site survey offers cost and time effectiveness as well as being extremely accurate. Using both RF and specialized algorithms, a predictive site survey simulates RF in your specific environment.

This software has become very accurate and gives an incredible view of their environment. When combined with an experienced Wi-Fi service provider, a successful design even in high-density areas can be achieved. The key to a good predictive survey is to have as much information as possible; we recommend using floor plans and building blue prints.

2 – On-Site

This type is highly recommended for more complex wireless objectives. This usually encompasses applications that roam from AP to AP and also tend to be latency sensitive. For example, RTLS in hospitals, wireless video surveillance and multi-media over wireless.

Typically with an on-site survey you use the predictive results to test them against the wireless design to prove that design in the real world, paying close attention to interference or noise. It’s important to simulate the applications that will be running on the network to make sure they work seamlessly.

3 – Passive

These types of surveys are good for validating your design requirements and used to collect RF data from all of the access points in a given area. It allows you to plot heat-maps giving you a nice view of where your coverage spans and where there are holes at different levels.

Some of the main design elements a passive survey can help validate are primary and secondary RSSI, Interference (noise), SNR and co-channel interference.

4 – Post Validation

A wireless network design can be great on paper but real success is when it performs exactly as it should for what it was designed to support. A post validation site survey makes sure your new network is performing as it was designed to, using the requirements you established at the beginning of your design.

Testing and measuring every detail guarantees you can support your applications or processes successfully with your new network. Some areas to take a closer look at are: data rates, device to radio ratios, jitter, latency and QoS, high density areas and co-channel interference as well as other RF characteristics.

You can even use an application performance test to test your network from the application side of things for a unique view of your networks performance.

It’s important to understand the various types of site-surveys; to know when each is needed, and to make sure your next wireless network is successful. In doing so we’re sure your stress levels will without a doubt go down.

Why?

With high quality analysis and detailed planning from using the right combinations of site surveys, you’ll be confident knowing your wireless network will not meet your requirements but in most cases exceed them. Proper planning allows you to quickly adapt and address issues (should they arise) precisely and timely, meaning less stress on you!

If you have any questions about your next wireless network design or you would like to have a site-survey started for your business/organization today, you can get in touch in one of the following ways:

Contact us: London 0203 322 2443 | Cardiff: 02920 676 712 | Winchester: 01962 657 390 |  [email protected]
 

https://www.securedgenetworks.com/blog/4-site-surveys-that-will-improve-your-wireless-network

Bluetooth That Will Make You Want to Cry

Question: What happens when you put 40 Bluetooth devices in simultaneous operation within 800 sq. feet of each other?

Answer: This…

Spectrum Analysis Capture of 40 Simultaneous Bluetooth Devices

Now think about this: Can you spot the Wi-Fi going on at the same time?

Here’s an image of the “baseline” Wi-Fi activity before the Bluetooth activity in the same environment. Can you can spot the Wi-Fi in this one? There’s a typical enterprise deployment with APs on channels 1, 6, and 11, plus an iperf performance measurement currently going on across channel 6.

Wi-Fi Baseline

What’s Going On Here?
This is a capture of 40 Honeywell Xenon 1902 cordless Bluetooth area-imaging barcode scanners operating at the same time. These units are used in retail environments at checkout registers to provide faster scan rates, ease of mobility, and overall a faster checkout process for customers. The “area-imaging” implies reading of 2D barcodes such as QR codes and such.

Bluetooth

Almost every manufacturer are using Bluetooth as the default communication method for cordless barcode scanners. Research has shown that only 2 out of 8 manufacturers of cordless barcode scanners support an alternative to Bluetooth (one used Wi-Fi and another used narrowband at 433 or 910 MHz). But every single one of them provide a Bluetooth option, and it is typically the more prominently displayed option on their websites. Information also suggests that manufacturers are all moving to Bluetooth scanners and support for other options will be phased out. So, if I wanted to choose a different option I could probably get one now, but support would be short-lived and I’d end up having to switch to Bluetooth anyway. So it makes sense to bite the bullet now and figure out how to deploy these in an environment where they can co-exist relatively peacefully with a Wi-Fi network.

Performance Impact
These units are rated as a Class 2 Bluetooth transmitter, meaning they should have a maximum power output of 2.5mW and an estimated range of 10 meters. Whilst this sounds nice and low, and you might expect minimal impact to Wi-Fi, the reality can actually be very different!

It’s important to understand the different impact that Bluetooth can have in an enterprise environment than in a consumer environment. The deployment scenarios can be dramatically different, and a high concentration of Bluetooth devices in a small area directly correlates to decreased performance. The standard duty cycle of a single Bluetooth device is small, but as Bluetooth devices density increases so does Wi-Fi performance impact due to increased CCA busy detection by Wi-Fi devices and increased frame corruption when Bluetooth can’t avoid APs on multiple channels. Even if Bluetooth version 1.2 and later capable devices are used that implement adaptive frequency hopping, they cannot avoid interfering with Wi-Fi access points spread out across the entire 2.4GHz frequency band.

When Wi-Fi performance testing with these Bluetooth devices was carried out, they ran multiple scenarios, changing Bluetooth power levels, pairing status, and scan rates. The results varied dramatically based on these settings. Our baseline was an 802.11g network with 20 Mbps throughput. The environment is an open-air retail setting at the front register checkout lanes.

Bluetooth Impact Scenarios

Clearly, despite being rated as a Class 2 Bluetooth device, the RF signal was carrying quite far. Luckily, Honeywell has done a good job providing management tools to customize the radio performance of their barcode scanners. By adjusting the power level down, the impacted area was minimized as well as the impact to the Wi-Fi network.

The situation was a challenging one though due to the desire to deploy VoWiFi around the same time as the cordless barcode scanners in the same environment. The preference was to use voice handsets that support 5GHz frequency bands, but that may not be possible due to other business considerations on device capabilities and application support. So, 2.4GHz voice tests were run that showed an average 20% frame loss rate when the Bluetooth scanners operated at 10% (0.25mW) and an unacceptable user experience. When the power level was reduced to 1% (0.025mW) the frame loss was much lower and no perceptible voice quality issues could be observed by end-users.

Ultimately, a compromise was found that allowed the use of these cordless barcode scanners while minimizing impact to the Wi-Fi network.

Deployment Considerations
Here are some considerations when deploying Bluetooth in an enterprise environment:

  • Device Selection
    Select Bluetooth devices that are configurable and easy to provision. The device should support modification of all of the settings listed below, and keep those configuration settings across reboots. If a device is factory-reset or the battery dies, it should be able easy to re-apply the custom configuration settings by staff in the field with minimal training and effort.

Recommendation – Purchase “enterprise-class” Bluetooth devices that allow custom configuration.

  • Device Density
    In general, the more Bluetooth devices operating in a confined area, the more impact to the Wi-Fi network. Pretty simple. Each individual Bluetooth device has minimal impact due to very low duty cycle (airtime used), but as more and more devices are added it linearly increases interference and decreases Wi-Fi performance.


Recommendation – Minimize Bluetooth device density as much as possible.

  • Power Level
    The Bluetooth transmission power level, especially in dense deployments, can have a dramatic effect on the impact to a Wi-Fi network. During testing, reducing power levels from 100% (2.5mW) down to 1% (0.025mW) significantly reduced the impact to the Wi-Fi network, and the range provided was still adequate to meet business needs.


Recommendation – Reduce Bluetooth transmission power to the lowest setting that still allows reliable functionality for a given deployment scenario.

  • Bluetooth Pairing
    The pairing status of a Bluetooth device can determine how actively the device transmits. A paired device usually transmits much less frequently than an unpaired one. Unpaired devices may constantly search for a base station or partner, often times transmitting very frequently in what many manufacturers call “distress mode”. Honeywell also provides a configurable scan timer that adjusts how long an unpaired device will search for its partner. This setting can be adjusted down to 3 cycles instead of infinite. It will also scan whenever the trigger is pulled. This minimizes interference in the worst-case scenario that the device gets unpaired.


Recommendation – Establish sound operational practices to ensure Bluetooth devices remain paired at all times. Additionally, adjust scanning timers down to a reasonable level from defaults.

  • Know Your Environment
    Bluetooth impact will also vary based on the environmental characteristics in which it is deployed. In the situation above the impact was significant because of an “open-air” environment. But that may not be the case in an office with many more walls and obstacles that prevent RF signal propagation. Also, know your Wi-Fi client device capabilities and applications. If you only use data applications like web surfing and file transfer, Bluetooth may not be a big risk. But if you use real-time applications like voice or streaming video, then it could cause usability issues.


Recommendation – Understand how Bluetooth impact will vary based on the facility characteristics and applications deployed on the Wi-Fi network.

  • Migrate Wi-Fi to 5GHz
    If you can’t mitigate the performance issues with Bluetooth or any other source of interference in the 2.4GHz spectrum, move your clients over to 5GHz. This one is easy to understand, but can be difficult to achieve in practice. Consider the influx of mobile devices that only operate using a single-radio 2.4GHz chipset. What applications will be used on those devices, and what is the implied or defined service level agreement between the network team and business teams?


Recommendation – Use band steering techniques or different WLAN configurations on the Wi-Fi network to move 5GHz capable clients over to this band.

http://revolutionwifi.blogspot.co.uk/2012/02/bluetooth-that-will-make-you-cry.html


Contact us: London 0203 322 2443 | Cardiff: 02920 676 712 | Winchester: 01962 657 390 |  [email protected]
WLAN vs Ethernet LAN

The difference between WLAN and Ethernet LAN

We thought it would be very useful to have a comparison between WLAN (Wireless LAN) and Wired LAN – The following post describes the difference between WLAN and Ethernet LAN.

In the figure-1 below, you will see the wlan or wireless LAN network. It operates on radio frequency 2.4 GHz or 5.8 GHz or both as per IEEE 802.11 specifications. There are various WLAN versions viz. 802.11a, 11b, 11g, 11n, 11ac and 11ad etc. The latest WLAN versions incorporate multiple antenna based MIMO techniques to provide support for higher data rates.

wlan network

In figure-2 below, you can see the ethernet lan network. You might like to also look up Ethernet types such as ethernet, fast ethernet and gigabit ethernet.

Ethernet LAN network


In summary, the core differences between wlan and ethernet LAN types are as follows:

WLAN Ethernet LAN
The WLAN devices are based on IEEE 802.11 family of standards. The Ethernet LAN devices are based on IEEE 802.3 standards.
WLAN devices use high energy radio frequency waves to transmit the data. Ethernet LAN devices use electric signals to transmit the data.
Radio frequency waves travel in the space. Hence a physical connection is not needed between the devices which are connected to the WLANs. Electric signals flow over the cables. Hence wired connection is needed between devices which are connected to the Ethernet LANs.
WLAN uses half duplex mechanism for communication. Ethernet supports full duplex mechanism for communication when a switch connects using a single device rather than hub.
WLANs suffer from interference of various types during travel from source to the destination. LANs suffer less interference as electric signals travel using cables.
WLANs use CSMA/CA to avoid collisions in the network. Ethernet LANs use CSMA/CD to detect collisions in the network.

For more info: http://www.rfwireless-world.com/Terminology/WLAN-vs-Ethernet-LAN.html


Contact us!

London 0203 322 2443 | Cardiff 02920 676 712 | Hampshire 01962 657 390 | Email [email protected]

Wi-Fi Frequencies: An Overview

There are actually more Wi-Fi frequencies than you may think, and with all of the current and future Wi-Fi frequencies and technologies out there, things can get confusing. This blog will take a a high-level look at what’s out there and what’s coming up.

The Well-Known Frequencies — There are two dominant Wi-Fi frequencies used by 802.11a/b/g/n systems; 2.4 GHz and 5 GHz. Almost all modern Wi-Fi devices are made to operate in one or both of these frequencies.

Public Safety — The same basic OFDM technology used by 802.11a in 5 GHz is also used in a 4.9 GHz public safety band. This band is 50 MHz wide, is only available in some regulatory domains and requires a license. This band has specific, limited purposes, so you don’t see a lot of commercial interest or attention here.

802.11y — The FCC also opened up 50 MHz of bandwidth in a 3.6 GHz licensed band. OFDM is also used here. In the US, this band usage is not limited to certain technologies so the band will be shared, but does require a license. It seems that there aren’t many benefits to this frequency band, and the interference avoidance requirements represent a moderate R&D requirement without much ROI.

VHT <6 ghz=”” 802=”” 11ac=”” u=””> —  You may have heard about this PHY spec in development. It builds on 802.11n MIMO technology in 5 GHz and seeks to expand on the HT PHY with a few developments that are a natural next step. 802.11n gave us 40 MHz bonded channels. 802.11ac will give us 80 MHz channels and, likely, 160 MHz channels. 80 MHz bandwidth will get us past the gigabit rate threshold. MIMO will also be expanded to 8×8, but since client devices aren’t adopting that type of power hungry radio anytime in the near future (or ever), 8×8 will be used for MU-MIMO. MU-MIMO allows an AP to transmit simultaneous downlink frames to multiple users (MUs).

VHT 60 GHz (802.11ad) — This PHY opens up a fresh use case for Wi-Fi in the form of very high throughput at short range. At the 60 GHz frequency range, there are a lot of challenges getting the kind of range that would be useful to enterprises. We’ll see short-range, high bandwidth applications, but I’m still failing to see the exciting benefits that have been touted in the press.

White-Fi (802.11af) — There has also been some exciting buzz in the past several months about TV whitespace frequencies between 50 and 600 MHz. The benefits and limitations of this band are discussed in a number of good articles out there. Contiguous bandwidth is in short supply which is a big issue with this frequency, so we see a handful of 6 MHz-wide channels which will yield lower transmission rates than 802.11a/g. The merits of a low frequency are fairly well known; that is, despite the throughput-deficient bandwidth, the range/coverage is advantageous. The evident winner with this technology are rural broadband applications, where coverage is more important than bandwidth and high user density.

Least and last — 900 MHz. 900 MHz was a popular pre-802.11-Wi-Fi frequency way back in the 1990’s. It often gets lumped in with Wi-Fi frequencies because it is an unlicensed ISM band. You’ll still see some legacy technologies working their stuff there, and you might see a few modern, proprietary ones as well. This is a semi-popular broadband frequency with decent range and limited throughput. Many vendors use proprietary PtP and PtMP solutions here for wireless distribution, but they are not defined by 802.11, and they are not designed for client access. Shame on them.

Frequency Recap:

  • 50-600 MHz TV Whitespace — Good range, low capacity.
  • 900 MHz — Proprietary PtP and PtMP. Decent range, slow rates.
  • 2.4 GHz — Well-known and used.
  • 3.6 GHz — Little-used, licensed band.
  • 4.9 GHz — Licensed public safety band.
  • 5 GHz — Well-known and used, the future of Wi-Fi.
  • 60 GHz — Short range, very high throughput.

Contact us!

London 0203 322 2443 | Cardiff 02920 676 712 | Hampshire 01962 657 390 |  [email protected]
 

https://www.cwnp.com/wi-fi-frequencies-an-overview/

Selecting The Best Antenna

 The following post talks about the importance of selecting the best antenna and understanding coverage patterns.

In any RF system, the antenna is the radiating element. RF waves are to be propagated through free space, and it is this component that causes this to happen. The antenna device also receives the RF signals from other transmitters. Available in various forms, the antenna results in varied radiation patterns and, therefore, various coverage patterns given the same RF power input. The antennas design impacts the reception of RF signals, in addition to varied radiating patterns.

Key factors when selecting an antenna are the gain of the antenna and the radiating pattern, as well as the frequency range for which the antenna is designed. Antennas should be either 2.4 GHz or 5 GHz antennas in most AP or bridge implementations today. Once you have identified the appropriate frequency band, the appropriate gain and radiating pattern must be selected.

Today, antenna gain is usually listed as dBi and is measured in decibels. This metric is achieved by comparing the antenna’s gain in the intended radiation direction against that of a theoretical isotropic radiator. The isotropic radiator is a theoretical antenna, radiating energy equally in all directions out of the antenna. Whilst it is considered spherical, no such antenna actually exists. For example, the common antenna included with a consumer-grade wireless AP or router is a 2-3 dBi antenna. This simply means that the antenna has 2-3 dB gain in the direction of intended propagation.

A higher gain antenna (for example, 11 dBi as opposed to 2.14 dBi) will radiate a receivable signal further in the intended direction in free space. Of course, indoors there will be reflections and other RF behaviours, so the signal may not radiate as far at acceptable signal levels as it would in free space, but it would still radiate farther than a lower gain antenna.

Now, the final part to consider when selecting an antenna is the radiation pattern or simply, the antenna pattern. Antenna charts are the most frequent mode of communication of antenna patterns. The horizontal and vertical radiation patterns of the antenna are shown in the charts. 

In the elevation charts, the vertical pattern is shown, and the Azimuth chart shows the horizontal pattern. 

Helpful tip! Remember that the elevation chart shows the radiation pattern of antennas as if you are looking at it from the side. The Azimuth chart shows it as if you are looking down on the top of the antenna (assuming the antenna is vertically upright).

Elevation = side view

Azimuth = top view

The following images show each chart type:


Once you’ve got the hang of this information, you can use it to easily select the appropriate antenna for you and understand the different coverage patterns you can expect from them.


London 0203 322 2443 | Cardiff 02920 676 712 | Hampshire 01962 657 390 | [email protected]
 

https://www.cwnp.com/selecting-best-antenna/

Calculating RF Wavelengths

Calculating RF Wavelength

Why would you need to calculate RF wavelengths I hear you ask? Well, an antenna needs to best receive the intended frequencies, thus the length of RF waves impacts decisions being made during the design process. This means you need to understand the wavelength of the RF waves being generated in a given frequency.

There are 2 basic formulas you can use to calculate RF wavelength. One is used for feet and the other for metres.

The following post will provide the formulas you need, plus an Excel spreadsheet for calculating the wavelengths for each 20 MHz channel centre frequency in the 2.4 GHz and 5 GHz bands.

802.11 channels work on a centre frequency. In the below spreadsheet, you will find the centre frequencies for each 20 MHz channel in 2.4 GHz and 5 GHz.

Wavelength Calculator

To calculate the wavelength in feet, the common formula is:

wavelength = 984 / frequency in MHz

The common formula to calculate the wavelength in metres is:

wavelength = 300 / frequency in MHz


So what are you waiting for? Get calculating!

Alternatively, you could give us a ring here at Geekabit – We are the Wi-Fi Expert afterall! With offices in Hampshire, London and Cardiff you could just get in touch with us and avoid the potential mathematical headache by letting us sort it out for you.

London Office: 0203 322 2443 /  [email protected]

Cardiff Office:  02920 676712 /  [email protected]

Winchester Office: 01962 657 390 /  [email protected]

https://www.cwnp.com/calculating_rf_wavelengths/

Customer focus: Southern Storage

The Issue
As a warehouse and storage facility, it’s necessary for the team to be able to use their barcode scanning guns to identify the location and correct picking of items, constantly throughout the work day.

They found that their existing Wi-Fi system was not providing coverage in all the aisles and racks at many points in their warehouse, meaning staff had to return to a central area or corridor to check they had picked the right item, wasting time and creating potential mistakes.

With the delivery of new barcode scanners it was also necessary to ensure that the network would work to the best possible speeds.

What We Did
Having reviewed the existing installation, we found that access points broadcasting the Wi-Fi channels were incorrectly placed, often sending the main strength of the signal upwards into the roof as opposed to down to the working areas, and nowhere near the corridors.

The network was a mix of various home quality Wi-Fi extenders and domestic access points, with overlapping channels on a variety of frequencies that caused interference and packet loss constantly.

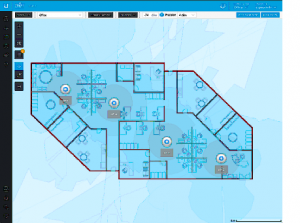
We replaced the existing access points with outside quality (warehouses are cold!) Ubiquiti Uni-Fi AP’s, and arranged the channels to ensure no interference and better utilisation of the free frequencies available.

These were installed correctly to ensure full coverage in all areas of the warehouse, and the power set correctly to ensure the barcode scanners successfully move between the AP’s seamlessly.

Take a look at what they do at Southern Storage https://southern-storage.co.uk/

WiFi Faces Technical Challenges

The emerging wireless standard promises better WiFi but the promise introduces significant complexity.

IEEE 802.11 standards (g, a, n, ac) delivered WiFi performance improvements out of the box. They focused on progressively increasing the data rate over the wireless link. All that was needed to take advantage of any new standard, was a radio chipset that incorporated the new radio and MAC enhancements.

The situation is different for the upcoming 802.11ax standard. The focus of 802.11ax is not on increasing the data rate but on improving the overall wireless network performance. This introduces significant new radio and MAC enhancements such as OFDMA and BSS colouring.

Ranking high among the issues is a transmission-scheduling mechanism. The downlink transmission scheduling in WiFi has been a simple FIFO (First In First Out) system. 802.11e introduced a small variation regarding the maintenance of multiple transmission queues for different priority classes.

However, 802.11ax introduces significant complexity in wireless transmission scheduling due to its OFDMA and MU-MIMO enhancements.

  •  With MU-MIMO, there is now an option to transmit a single wireless frame to a single client or concurrently transmit different wireless frames to multiple clients using multi-user beamforming.
  • With OFDMA, there is now an option to transmit a single wireless frame to single client using traditional OFDM or concurrently transmit different wireless frames to multiple clients using subsets of channel width.
  • 802.11ax introduces multi-user transmission in uplink direction too. The AP needs to schedule multiple clients for concurrent uplink transmissions according to their requirements.

These methods need to take into account service requirements of traffic flows, radio conditions on the channel, client capabilities and client state feedbacks. It is no easy feat to come up with scheduling mechanisms that will work in most practical scenarios with relative ease of configuration and fine tuning.

Children and Technology: how young is too young?

The generation gap is getting bigger and bigger the more technology advances. We see it every day with children, yes CHILDREN have better phones than you do. How often do you see it in the work place or a social setting where everyone in on their phones and not talking?. Well it’s worse for the children of today. Gone are the days where you would go out, climb and tree and hurt yourself!

Studies are showing how big of a role social media and technology play a part in a Childs life today. The average age for getting a smart phone is currently 10.3. Children use their phones overwhelmingly to text and 31% of parents surveyed said their kids have texted them even when they’re in the same house together.

There is of course a useful safety feature on a smart phone of being able to use the GPS to track your child. Although this doesn’t not sound like a fun part of growing up as that is the last thing you would want being a teenager, it certainly has a time and a place. While not many parents have embraced the ability to use Smartphones’ GPS capabilities to track down their kids, the number who has used this function doubled from 7% in 2012 to 15% in 2016.

Phones have risen on the list of devices kids look to for entertainment on car trips and remain second only to iPads and tablets as the engagement option of choice for the road.

  • Tablets have taken off for this purpose, increasing in usage from 26% to 55%.
  • Phones come in at 45%, up from 39% in 2012, and DVDs have fallen to third place in the car with 35% reporting usage today, versus 48% in 2012.
  • The once popular Nintendo DS now dropped to a distant fourth choice at 24%, down from 40% four years ago.

Parents’ restrictions (texting, social media platforms, apps, timing) on their kids’ phones increased from 14% to 34% since our last survey. Proving to be most common form of punishment for todays technological geeks. Especially as 50% of children will have social media account by the age of 12.

  • Social media consumes kids today as well, as most score their first social media accounts at an average age of 11.4 years old. The largest percentage of kids – 39% – got their first account between ages 10 and 12, but another 11% got a social media account when they were younger than 10.
  • Facebook and Instagram represent the most-used social platforms among kids, with 77% using each. But Twitter continues to climb with 49% of kids, and a newer entry, Snapchat, with 47%. No other social media platforms have a significant presence on kids’ radar.

What are your thought on this topic? Do your children have smartphones? How much do you monitor their use and what they are looking at? Let us know.