Could 40% of UK 5G Mobile Connections Actually be 4G?

A recent study seems to think so. Current research with foundations in monitoring and examining mobile phone reception, appears to show that despite your handset indicating a 5G signal, it actually only has a 4G connection. 

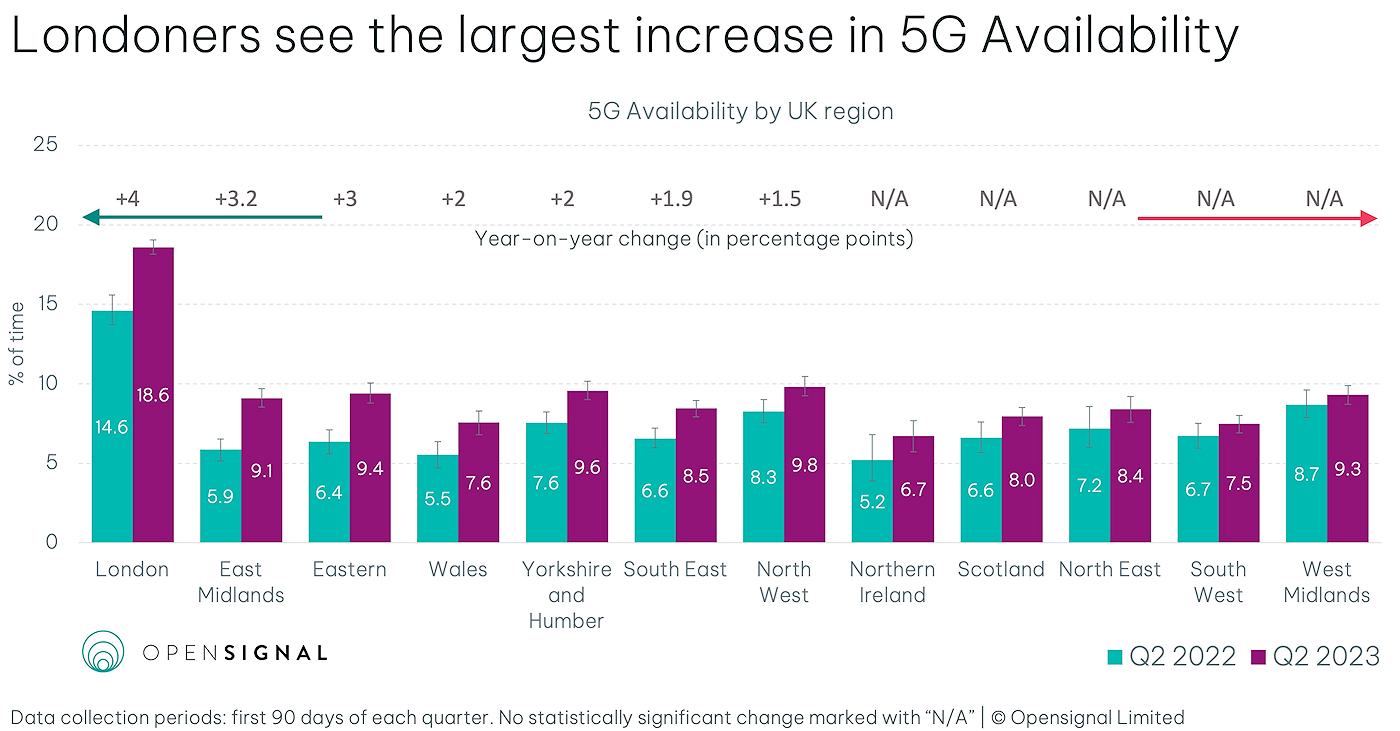
Samples taken from UK testing showed 38% of connections were 4G, even though the 5G icon was being shown. 11,000 tests were carried out over a period of 2 months at the start of this year. 

Why would a handset indicate it’s connected to 5G, if it’s actually using a 4G connection? 

It can differ from phone to phone, but for many if the phone is connected to a base station that has 5G equipment potentially available, then it will show the 5G icon. However, in real usage terms the connection may be using 4G or 5G. 

Some phones will change the distinction of the icon depending on whether an actual 5G connection is made. Others will show the same 5G icon whether the 5G connection is only available or actually connected.

The above image shows an area map of Central London where testing was carried out. The red shows actual 5G connections, and the blue indicates where a 5G icon is displayed but a 4G connection is made. 

As you can see for yourself, a 4G connection being used under the guise of a 5G connection is a common one. 

This issue isn’t anything new, but what is new is the research looking at how this is impacting our connections in the UK. 

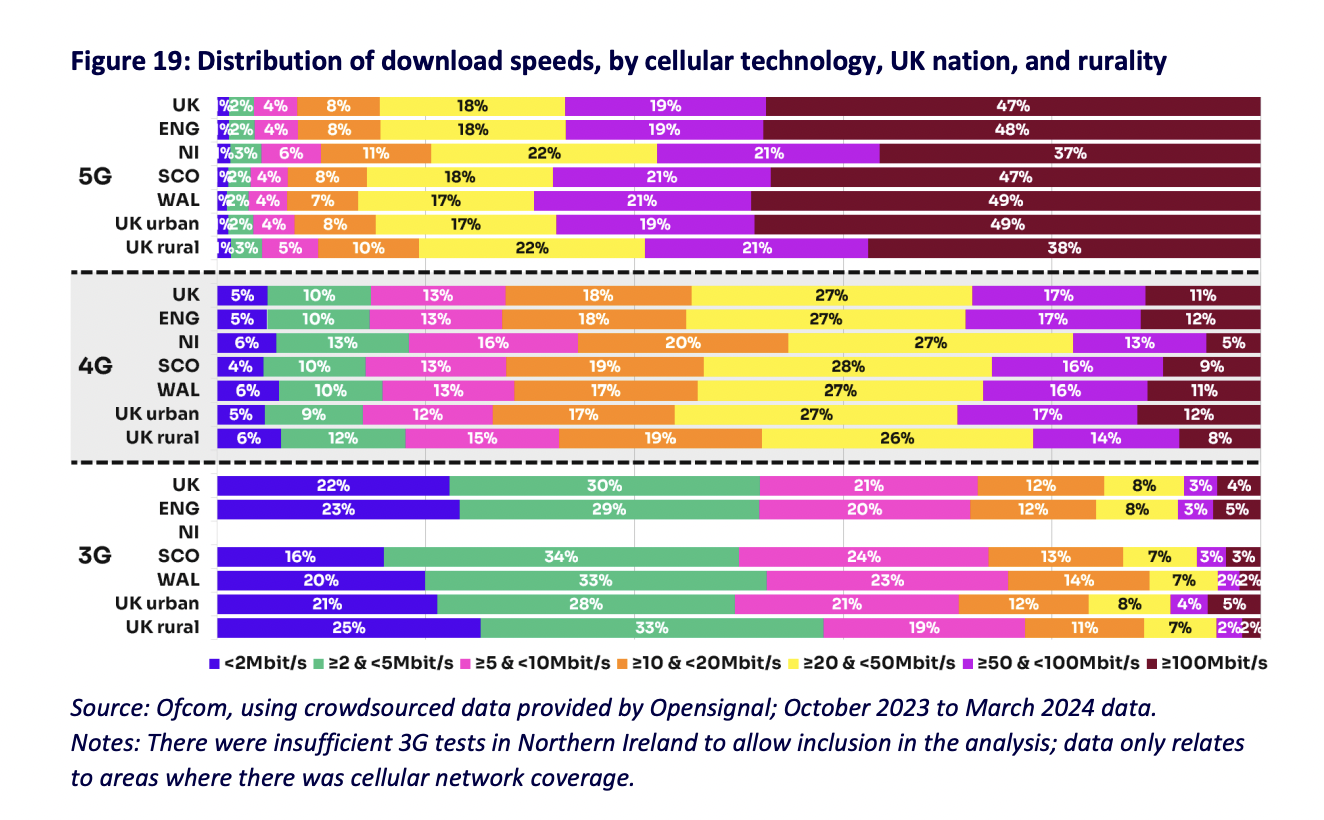
With an average speed of 49 Mbps, this recent study found when testing that mobile broadband via actual 5G is approximately twice as fast as where it’s a 5G icon only (27 Mbps). 

Is 4G masquerading as 5G happening across all UK mobile networks? 

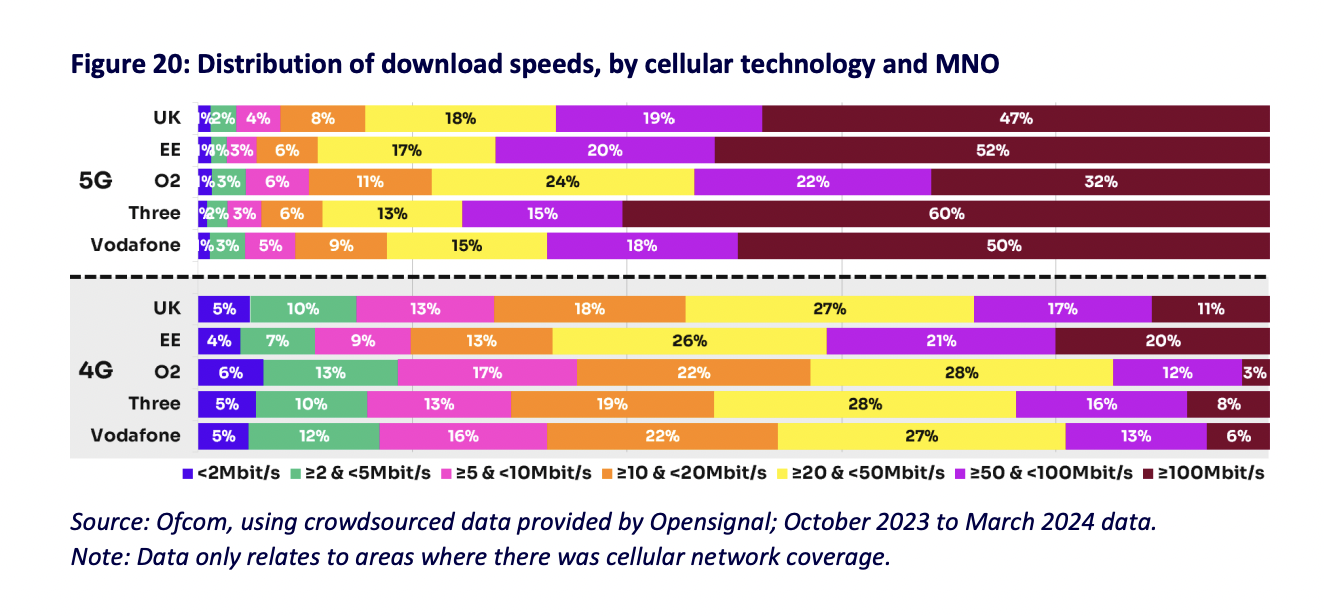
The results from this study were taken from a sample across all the UK mobile networks. However, it did find that it was more common with some operators than others to display the 5G icon despite being connected to 4G. 

Let’s have a little look at each mobile network. According to study tests, when the 5G icon is displayed, what percentage of the time are you actually getting a genuine 5G connection?

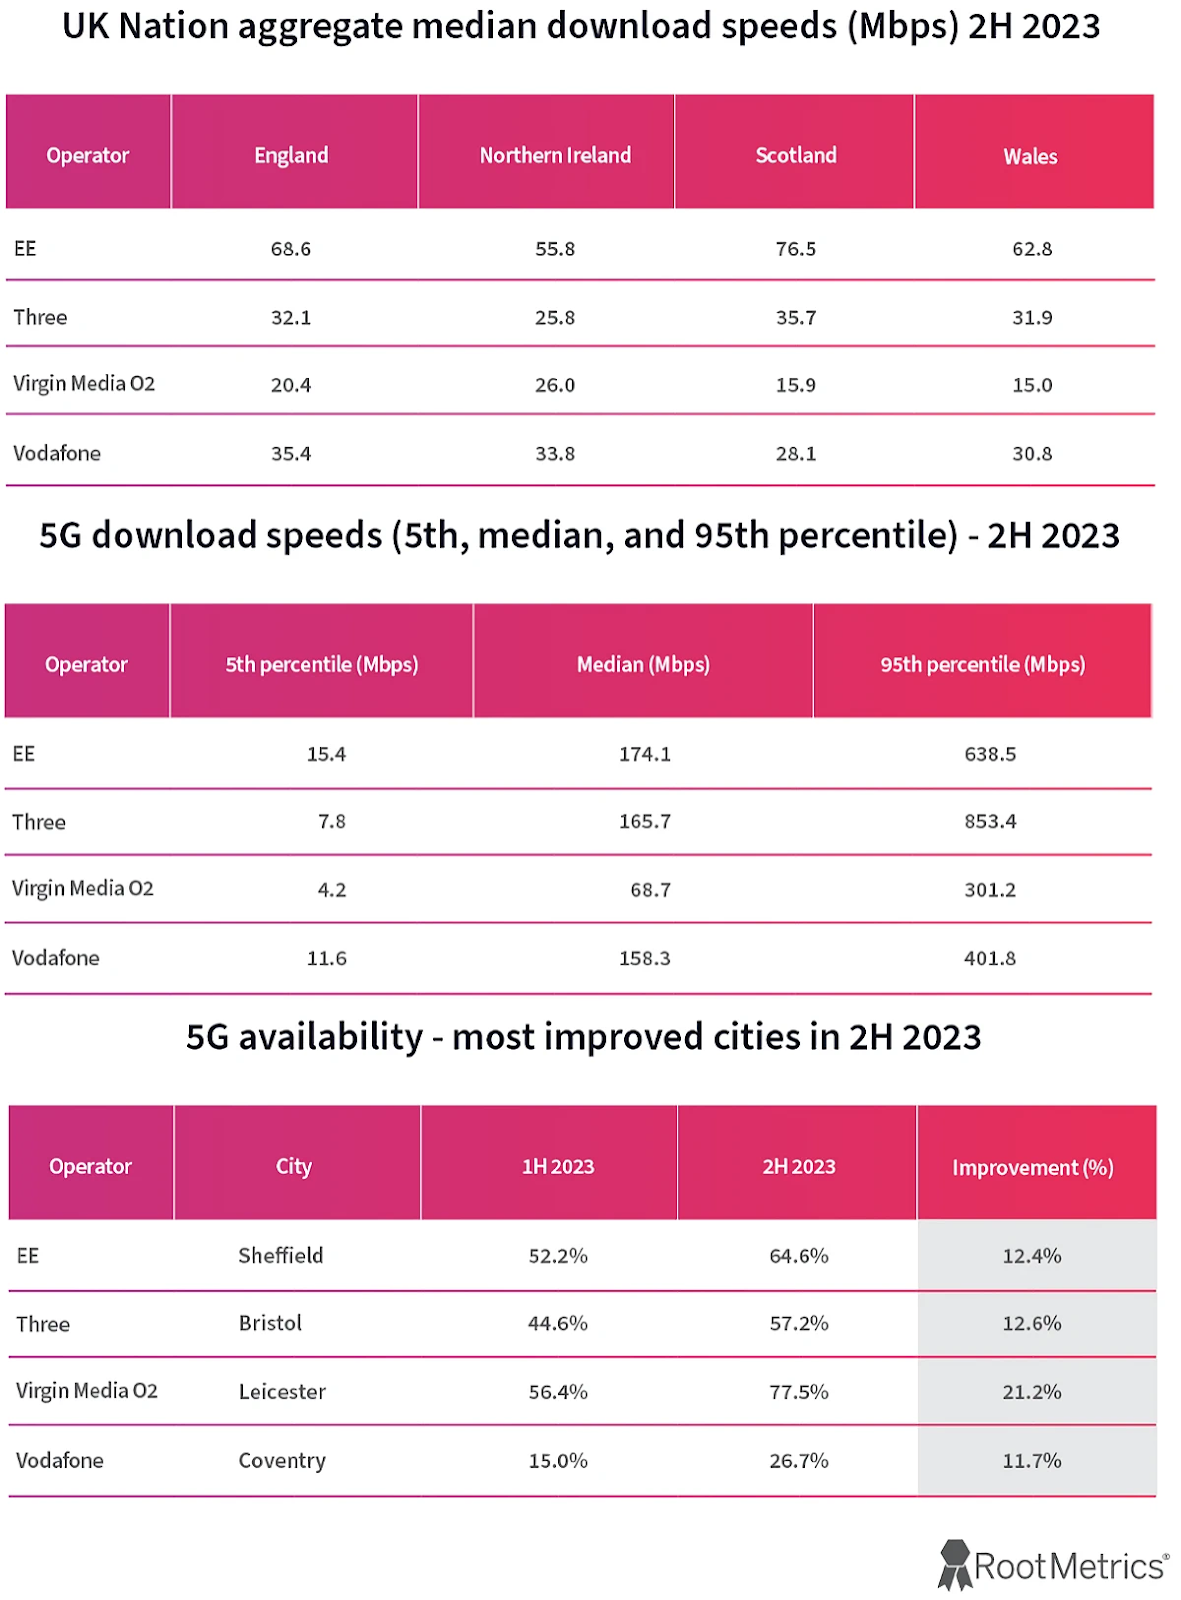
Three UK:  94% of the time 

Vodafone: 93%

O2: 66% 

EE: 32%

These findings are surprising, as other surveys and studies have found EE to do well in 5G performance in terms of data and coverage.

It’s important to bear in mind that getting a 5G connection everywhere is likely not possible, and people would largely accept a 4G connection in its place where 5G isn’t a possibility. The important bit, perhaps, is the visibility to consumers in terms of what they are actually getting moment to moment. Customers should know whether they are connected 4G or 5G and not just shown a blanket 5G icon where there is merely potential. 

We’re all for using 4G in places where that connection is going to be stronger and more reliable than a 5G connection. But let’s make sure customers are aware when this is happening. 

Vodafone UK Named as London’s Best Mobile Network by Net Check Study

A recent network benchmarking study looking at 4G and 5G performance (for broadband and calls) across London has named Vodafone UK as the top performing network. 

Based in Berlin, NET CHECK completed their London study of mobile network performance and found that Vodafone achieved the highest number of ranking points – Scoring 932.83 out of 1,000 points.  

Who is NET CHECK?

NET CHECK was founded in 1999 to improve the quality of communication networks. Since then, NET CHECK has become one of the leading partners of network operators and infrastructure providers in the operation and optimisation of mobile and fixed communication networks of all technologies.

When and where was the network study conducted?

Between the 30th October and 7th November, a team from NET CHECK carried out a mix of performance based tests across all 32 London boroughs plus the City of London using Samsung S23+ smartphones. 

Covering 23 routes, the measurement technicians covered a distance of 1018km across Greater London whilst driving. The measuring equipment (SwissQual Benchmarker II (Rohde & Schwarz) and Samsung S23+) was placed in the roof boxes of two passenger cars collecting data on the performance of voice and data services during the tests. This approach allowed performance measurement for all the operators simultaneously and at the same locations. 

How did the network study allocate points?

As we said above, the maximum number of points a network provider can rank is 1,000. This is earned by a max of 350 points for voice services and a max of 650 points for data services. 

The testing involved a range of both voice and data services, with categories including:

  • Accessibility
  • Reliability
  • Speech quality  
  • Mobile broadband speed-tests using customer applications such as the browsing of popular web pages, video streaming and more. 

Sample wise, they collected approximately 15,700 data samples per operator to enable them to accurately analyse data services. For voice services, they made approximately 1,390 test calls. For each test call, they collected 12 speech samples which resulted in approximately 16,600 speech samples in total.

Which networks were close behind frontrunners Vodafone?

As we stated above, Vodafone ranked the highest in terms of points with 932.83 out of 1,000. 

Not far behind them was EE with 923.45 – Only about 9 points less than highest ranking Vodafone. 

In 3rd place it was O2 Virgin Media  with 834.16 points, with Three UK trailing behind its competitors with 757.82 points. 

You can see a summary of results from the study below. To have a read of the full report, head here.

With thanks to NET CHECK for all the tables and imagery, directly from their report.

What are the Weaknesses in UK 5G Mobile Deployments?

 Independent British political public policy think-tank the Social Market Foundation has released a new report ‘Growing Connections’ highlighting how the UK still has a while to go before achieving prevalent 5G mobile connectivity. 

What’s the reason for this? The report claims that this is partly due to investment being unintentionally hindered by previous mobile telecoms policies. Solving this isn’t likely to be easy or straightforward. 

Data from Ofcom earlier in the year (January 2024) revealed that 85-92% of UK premises can now get outdoor 5G coverage from at least one operator. When combining all operators, this figure for outdoor coverage drops to just 16-28%. 

Ofcom doesn’t currently offer a figure for 5G geographic coverage, but we’d imagine that it would be quite a bit lower than the aforementioned 85-92%.

The new labour government has reiterated a previous pledge by the last in power where “all populated areas to be covered by ‘standalone’ 5G (5G-plus) by 2030.” Labour plan to follow through with a renewed push to achieve the ambition of full gigabit and national 5G coverage by 2030. 

UK Trailing Many Countries When It Comes to Active 5G Connections

Growing Connections’, this new report from SMF, looks at crowdsourced data from Opensignal in 2023, which showed that 5G availability and the amount of time users spent with an active 5G connection, found that the UK was trailing behind many other countries. 

Did you know that UK mobile users have access to 5G around only 10% of the time? In comparison, other countries show figures of:

  • India (43%)
  • South Korea (38%)
  • France (20.6%) 
  • Italy (17.9%) 

Further data from Opensignal was used in the report, looking at the analysis of international 5G download speeds. The UK, again, is amongst the slowest, with a score of 111Mbps. That might not sound too awful, but when compared to some other countries (like 133Mbps in Italy and a whopping 437Mbps in South Korea) it finds the UK lacking. 

The UK was one of the first countries to start rolling 5G technology out, so it is rather disappointing to see that we are considerably behind other countries. 

Furthermore, the SMF report also highlights how findings from another study had shown that, by 2035, “widespread availability and use of 5G could add £159 billion to the UK economy“. That’s a big thing to potentially miss out on. 

But let’s remember that the world doesn’t yet revolve around 5G. Predictions such as this should be taken carefully, especially as we have good 4G services that do deliver many of the benefits we’ll get from 5G. 

So What Went Wrong for the UK When Starting the Deployment of 5G?

Previous Mobile Telecom Policies

As we touched on earlier, the report mentions investment being hindered unintentionally by some policies in the mobile telecoms sector. We found it surprising that the report didn’t specifically mention the decision to ban Huawei after the beginning of the rollout, which set the deployment plans back with a pretty significant blow to mobile operators. 

Mobile Spectrum and Investment

The report does instead discuss the approach to spectrum by the Government and Ofcom, looking at the associated high costs involved with accessing and using mobile spectrum alongside the shortness of spectrum licences that are awarded. This in turn then deters the ‘very long-term investment’ and makes it ‘less useful as an asset.’

Slow Release of Spectrum Bands by Ofcom

Ofcom has also been slow to release more spectrum bands for 5G. Other countries around the world have had access to mmWave bands for years, yet here we are in the UK still waiting for mobile operators to have this same access. 

Cost Cutting Exercises Result in Less Land for Infrastructure

The SMF report mentions how making it cheaper for Mobile Operators to operate mobile masts (ie. cutting the costs of building infrastructure) has actually resulted more land disputes between landowners and builders, less land being supplied for said infrastructure and an increase in expensive litigation. 

Planning System Delays

Delays in the planning system have been well documented, with objections to new masts from the public and the reluctance to resolve these causing complex situations. 

The roll-out of better broadband and mobile networks – especially those in remote, rural, hard to reach areas – Must be supported by those in powerful positions. There needs to be a balance. 

Mobile Operator Mergers

Another limiting factor to investment is the low level of profitability for mobile networks. The SMF report looks at the encouragement of consolidation and mergers (such as that of Vodafone and Three UK), but the evidence of the success of this is a mixed bag. 

The CMA (competition watchdog) have noted that whilst mergers will reduce competition between operators, it could also cause a hike in prices for consumers. Apparently there are negotiations taking place to try and address this potential issue. 

Report Supporters

It’s important to note that the SMF report was supported by APWireless – A company viewed by operators as being a land aggregator. They seem to adopt a lease premium model that would involve buying out the expiring leases from landowners and then charging a higher cost to mobile operators for that same land lease. 

A company with a business model such as this would perhaps not welcome the possible plans from the government looking to reform the Electronic Communications Code. This code governs land and property access.

What’s the conclusion for UK 5G deployment weaknesses?

Whilst the report is a high level summary of the current problems facing the UK rollout of 5G, it doesn’t go as far as making suggestions or recommendations of what to do about it. 

It is also potentially influenced by the perception of a company with a vested interest in the areas being discussed. It certainly makes an interesting read, with the added opportunity to flex your critical thinking skills. 

Speeds of UK 4G and 5G Mobile Networks Benchmarked by Ofcom Study

Ofcom, the UK telecoms regulator, has recently published their latest Mobile Matters report for 2024. The report, using crowdsourced data from Opensignal collected between October 2023 and March 2024, has been used to benchmark how UK mobile broadband networks are performing. It includes data for Three UK, O2, Vodafone and EE.  

You might be a bit surprised by some of the results – The study was full of interesting details and revelations. 

Prevalence of 4G Connections Over 5G

Interestingly, over this 6 month period, 78% of cellular network connections were to 4G networks. Just 19.6% of connections were on 5G. 

Where a 5G network was available from their mobile network operator, mobile users were able to access data services on that 5G network on 98.4% of occasions. This is compared to 97.2% on 4G and 85% on 3G. 

More 5G Mobile Connections in Urban Areas than Rural

Mobile Connections via 5G in urban areas were double that of rural areas (20.9% compared to 10.4% respectively). 

Generally, 4G was more prevalent in rural areas than urban. 

Rural – 4G (85.6%), 3G (3.8%)

Urban – 4G (76.9%), 3G (2.1%) 

You may also be interested to see how this differs across the nations. 

And by mobile network operator (MNO). 

As you would expect, 5G networks were found to offer faster downstream connectivity than 4G and 3G. 

The percentages of an average download speed of 100 Mbit/s (or higher) were

5G: 47% 

4G: 11%

3G: 3%

The percentages of an average download speed of under 2Mbit/s were

5G: 1%

4G: 5%

3G: 22%

Which mobile network had the best download speeds over 5G?

The highest share of those higher download speeds on 5G (100Mbit/s and above) went to Three UK with 60%. O2 had the least connections with that download speed over both 5G (32%) and 4G (3%). 

Which Mobile Network Has The Fastest Response Time? (Lowest Latency)

For 5G connections, Three UK had the fastest average response time (16.3 milliseconds). In comparison, the fastest average response time over 4G was EE (18.3ms). O2 again lagged behind, with customers revealing the slowest average response time on 5G (21.4ms) and over on 4G it was Vodafone with the slowest response time (23.7ms).

A Wealth of Mobile Data

This report is packed full of interesting data – Far too much for us to be able to share in one article unfortunately! We’d be here all day.  

We’d certainly recommend perusing the data tables and reading through the results of what Ofcom and Opensignal have to report from consumers over this latest study’s 6 month period. 

You can read the full report here. What stood out most to you?

Teltonika Network Setup – What is RSSI and RSRP? 

Enable yourself to get better understanding and control of your Teltonika networking solution’s performance with wireless connection support display RSSI and RSRP signal strength. 

Familiarising yourself with RSSI and RSRP metrics wireless network support will help to enhance your Teltonika Networks next steps. 

Wireless Networks are the preferred choice for IoT connectivity

When it comes to IoT (internet of things) applications, wired connections once held dominance. But it is becoming increasingly evident that the preferred choice for IoT connectivity is wireless networking. 

The wireless connectivity market is expected to continue to grow at a compound annual growth rate of 12.8% in the next 3 years, solidifying the trend of networking solutions becoming increasingly dependent on Wi-Fi or mobile networks. 

Due to the versatility and convenience offered by wireless connectivity, this doesn’t come as much of a surprise. 

Without the limitations of wiring, network devices can be configured, monitored and managed remotely – Even if they’re in a different city, country or continent. 

The benefits of using a wireless connection are indisputable.

What are the primary connectivity options? 

There are 2 primary choices when it comes to wireless connectivity: Wi-Fi and mobile technology. 

Wi-Fi 

  • Operates on the IEEE 802.11 standard
  • Supports multiple protocols including 802.11a, 802.11b, 802.11g, 802.11n and 802.11ac (determining the connection’s speed and range)

Mobile Technologies

  • Have evolved from 3G to 4G to 5G
  • Each defines the connection’s speed and capacity available to users and end devices

RSSI and RSRP

Whether your network device operates on Wi-Fi or mobile technologies, if you’re checking out your network then you’ll likely come across RSSI and RSRP metrics. These metrics are vital for displaying the strength and power of your connection. 

What is RSSI, what does it do and how is it measured? 

  • RSSI stands for Received Signal Strength Indicator. 
  • At the moment radio frequency power and quality reaches the receiver, it’s measured by RSSI. For example, a network device or antenna. 
  • RSSI can be used to gauge the strength of the signal in any wireless system, it’s not exclusive to any one type of wireless technology. 
  • Whether you’re using Wi-Fi or mobile technologies, RSSI can provide signal strength data across different types of radio frequency communications. 
  • This means that RSSI can be a good indicator of whether your network devices have robust connectivity.
  • RSSI signal strength is measured in negative values, with stronger, higher quality signal values being closest to zero.
  • NOTE: RSSI values are not standardised across industries, so bear this in mind when interpreting network data for devices manufactured by different companies. 

What is RSRP? 

  • RSRP stands for Reference Signal Received Power and is measured in negative values.
  • RSRP is particularly relevant for mobile technology network solutions like 4G and 5G.
  • It is a type of RSSI measurement, but used to measure the power of mobile signals spread over full bandwidth and narrowband.
  • RSRP measurements can help you to see your network’s overall signal coverage and capacity across all frequencies used for your networking solutions by measuring across the full bandwidth.
  • The quality of your connection in specific frequency ranges can be assessed by measuring RSRP over a narrowband. This can be used to troubleshoot specific issues that could affect signal quality as well as optimising network performance.
  • By using the RSRP signal strength, you can determine a more precise measurement of the cellular connectivity that your network receiver obtains. Having this information can enable you to make informed decision about your network infrastructure as well as Quality of Service Assessments and further improvements.
  • NOTE: Just as with RSSI, the RSRP signal strength can differ by manufacturer.

Your Teltonika Network

Both RSSI and RSRP signal strength indicators are displayed for Teltonika Network devices enabled with Wi-Fi or mobile connectivity devices.

The display of these metrics can be accessed via RutOS. The latest 7.06 version of RutOS has enhanced data visualisation capabilities for mobile connections.

For help with your Teltonika Network, get in touch with our Wi-Fi experts today. Our professional wireless network engineers can help with both Wi-Fi networks and mobile connectivity. 

We can also help with alternative networks other than Teltonika. 

Top UK Mobile Networks for H2 2023 Revealed by RootMetrics Benchmark

How did UK mobile networks perform in the second half of 2023 when it comes to 4G, 5G and mobile broadband?

RootMetrics (now an Ookla company), a mobile analyst firm, has not long published their latest benchmark study of UK mobile networks (4G and 5G) and mobile broadband performance for H2 2023. 

RootMetrics offers scientifically collected and crowdsourced mobile network performance information to consumers and the industry. The firm captures user information by testing network performance when consumers are using their mobile phone for voice or data communications. 

Results of the latest biannual benchmarking report which once again see EE (BT) come out on top against their UK network rivals at Vodafone, Three UK and O2 (VMO2). 

Which UK mobile network is the best for 4G/5G?

When it comes to 5G performance, the picture painted by this recent report isn’t so clear-cut.

This latest study used data from a 5G-enabled, latest model of Samsung smartphone (the actual model was not disclosed in the report). It was purchased from operator stores and tested for both 4G and 5G performance across all 4 primary UK operators within 16 of the most populated UK cities. 

In summary, the study consisted of:

  • 1 latest model Samsung smartphone
  • 4 primary UK mobile operators
  • 16 UK cities
  • 634,942 tests across hundreds of locations
  • 788 locations were indoor
  • 24,179 miles driven during both the day and night

Results were divided into the following categories:

  • Network reliability
  • Speed
  • Data
  • Call and text quality

Scores were given out of 100 (100 being the highest score). As you can see from the data representation from RootMetrics below, EE came out on top across all categories, while VMO2 were found at the bottom of most. 

Interestingly, every one of the 4 primary UK operators saw a decrease in their overall scores when compared to the last RootMetrics report 6 months prior. 

The Overall Scores for H2 2023 (vs H1 2023), in order of best to worst, are:

1. EE – 94.2 (down from 95.9)
2. Vodafone – 90.1 (down from 92)
3. Three UK – 89.3 (down from 90.2)
4. O2 – 86.4 (down from 86.7)

So which is the best UK mobile network? When we look at the average (median) UK download speeds for both 4G and 5G networks, then the strongest data speeds were delivered by EE (68.6Mbps, which was up from 65.1Mbps in the last report).

Vodafone also saw an increase in data speeds, increasing to 34.5Mbps (from 29.4Mbps). Despite O2 improving their data speed score from 15.5Mbps to 19.9Mbps, they still scored the bottom of the 4 providers. Just behind Vodafone to take 3rd place, Three UK fell slightly to 32.3Mbps (down from 34.7Mbps). 

How is 5G performing on UK networks so far?

However, when we look purely at 5G networks, we see a bit of a different picture emerge when compared to the previous report for the first half of 2023. 

Whereas H1 2023 saw Three UK as the fastest median 5G download performance, that award now goes to EE. O2 were unfortunately at the bottom with a score well below the other 3 primary UK networks. The scores for median download speeds for 5G from the H2 2023 report were:

  1. EE – 174.1 Mbps
  2. Three – 165.7 Mbps
  3. Vodafone – 158.3 Mbps
  4. O2 – 68.7 Mbps

What is the availability of 5G on UK mobile network providers? 

As well as 5G speeds, the availability of 5G across UK networks was also tested. 

All 4 of the UK mobile network providers had 5G availability of over 52% during this latest UK wide testing. 

The UK providers in order of 5G availability are:

  1. Three – 57.6%
  2. O2 – 54.5%
  3. EE – 52.3%
  4. Vodafone – 41.9%

You can find more data below for particular regions as well as the most improved cities. 

What can we take away from this report on 5G speed and availability on UK mobile network operators?

So it would seem that even though EE has the fastest 5G speeds, that 5G connection is less available than that of its competitors Three and O2. 

Despite coming second place in terms of speed, Three weren’t too far behind EE and are also slightly more available. 

O2 might have decent 5G availability, but the speed of that connection is pretty dire according to this latest report. 

In terms of 5G speed, Vodafone aren’t too far behind rivals EE and Three, however they are at the bottom of the pile with the lowest 5G availability. 

What more would we like to know about 4G/5G connections across the UK mobile networks? 

If you’d like to read more on this and see further data, head to the full report from RootMetrics UK Mobile Performance Review 2H 2023 here

Whilst this review does shine a light on 5G speeds across the UK and how UK mobile networks are performing, it does only give select information. 

It would be interesting to also see how the networks perform when it comes to upload speeds and latency using 4G/5G connections. 

As you can see from the review, there seems to be a strong focus on urban areas across the bigger cities in the UK. Here at Geekabit we talk a lot about the struggles of rural businesses and more remote locations that still need strong 4G/5G mobile broadband connections. Some more data on the performance of UK mobile networks in these areas would be beneficial and would give a clearer picture of 4G/5G availability and speed across the UK as a whole. 

Connections Boosted by VMO2 5G Drones for Search and Rescue Missions

Here at Geekabit we talk a lot about the problems that rural areas face when it comes to connectivity – Whether it’s mobile or broadband. 

Mostly we’re talking about businesses and homes that struggle with more traditional forms of broadband internet connectivity as well as mobile broadband options. 

But what about organisations that rely on connectivity outside the normal 4 walls of business premises?

For Search and Rescue teams, staying connected couldn’t be more vital. Yet, they’re often plunged into rural and remote locations trying to find someone missing and potentially hurt. 

So how can we make sure that these Search and Rescue teams stay connected with their base and are able to utilise location data? 

Virgin Media O2 (VMO2) has come up with just the solution. They’ve recently developed a 5G-connected drone that is specifically designed to bolster the communication that is so vital to Search and Rescue teams. 

Who is trialling this 5G drone for Search and Rescue teams? 

The first Search and Rescue team to trial VMO2’s 5G drone is Warwickshire Search and Rescue team.

As we said above, communication in remote and vast terrains is absolutely vital but can be a challenge for Search and Rescue teams. As the work of these teams is so time critical, it’s essential that their effectiveness is unhindered by communication and connectivity problems. 

As a Lowland Rescue Unit, the Warwickshire Search and Rescue team play a vital role in locating vulnerable missing persons alongside the police. 

With a 45% increase in callouts between 2020 and 2022, the demand for their services continues to surge with 65 callouts in 2023 – That’s more than 1 per week. 

How does VMO2’s 5G drone work?

The 5G Technical Trials Team over at VMO2 saw this need for critical connectivity and devised a portable solution that uses a network of low earth orbit (LEO) satellites. The portability and compactness of the tech means that it’s small enough to be integrated into a drone. Ideal for vast, remote spaces. 

This easy-to-deploy drone acts like a flying mobile phone mast, enabling Search and Rescue teams to stay connected via seamless 5G connectivity regardless of their location.

What do VMO2 have to say?

Here at Geekabit we love to see how innovative thinking and technological advancements combine to create fresh ideas and impactful solutions to a whole range of problems. 

Head of Technical Trials for Virgin Media O2, David Owens, says:

“This project is a further example of how fresh-thinking and 5G technologies can be combined to provide real societal benefits.

“The solution has the potential to transform how search and rescue teams operate and respond to life-threatening situations, enabling them to make faster and more decisive decisions. We’re enormously proud that our connectivity will be able to help these teams to save lives.”

What do Warwickshire Search and Rescue make of the 5G drone?

Trustee and Search Technician at Warwickshire Search and Rescue, Steve Brown says: 

“With more and more callouts each year, this drone with mobile connectivity is a powerful tool for our team to understand and assess a situation immediately, saving crucial time in life-threatening situations.

“It means we will always be connected, ensuring seamless communication and efficient coordination throughout our missions. As a result of this, we will connect the unreachable, save lives, and inspire a new era of technological possibilities.”

There’s no doubt that this innovative use of 5G mobile connectivity is a fantastic example of how technology can be used in even the most hard-to-reach places. 

In the UK, someone is reported missing every 90 seconds. The more swiftly that person can be located, the better the outcome. For those that have gone missing in a remote area, a Search and Rescue team that can stay reliably connected will be a huge advantage. 

As Portfolio Holder for Fire & Rescue and Community Safety at Warwickshire County Council, Councillor Andy Crump said: 

“The Warwickshire Search and Rescue team do such vital work for our local community by assisting the police in searching for missing people. 

“This new solution from Virgin Media O2 will help the team on these missions and ultimately save many lives. It is further evidence of the positive impact improved connectivity can have upon our society.”

We’re looking forward to seeing how 5G drones and satellite broadband technology can be accessed in more remote areas and rural locations.

UK Broadband Speeds Vs The World – How did 2023 Compare to 2022?

Is it even a new year if we’re not looking back over the previous one analysing every little thing? What was done well? What could be improved upon? What do we hope the new yera will bring? 

The tech world is really no different. We were interested to look back on how the UK performed in comparison with the rest of the world when it came to fixed broadband and mobile broadband (4G and 5G) speeds during 2023 and how that compared to the previous year. 

How does the UK compare to the rest of the world when it comes to fixed line and mobile broadband?

If you’re here for the fast answer: In a ranking of the top fastest countries, the UK was 51st (a fall from 44th during 2022) for mobile broadband and came 56th for fixed lines.

You can see the full report over at www.Speedtest.net from Ookla. This service benchmarks internet connections from around the world by publicly tracking the data available. 

Whilst it remains true that mobile and fixed line broadband can of course be affected by other factors within each individual connection (like slow Wi-Fi between the router and user device, local network congestion, package choice by individual consumers, the server performance of speedtest.net itself) this is also true for all the countries included so it shouldn’t be enough to affect the results significantly. 

FAQ’s on the Data

When is the speedtest.net data collected?

The data is collected in November each year. 

What average is used for the data speeds?

The figures are all ‘median‘ averages.

What is the main differentiator for speeds between countries?

The main differentiator for speeds between countries tends to stem from the balance between network availability and the take-up of faster connection types. 

Countries will rank highest in the table when they have a high coverage of gigabit-capable broadband networks and/ or strong 5G mobile services (with plenty of radio spectrum to harness).

How are the UK doing when it comes to mobile and fixed line broadband?

Over the past year we’ve seen a consistently strong improvement in terms of the availability of faster fixed and mobile networks here in the UK. 

It was recently revealed by Ofcom that 1Gbps capable fixed gigabit broadband networks had reached 78% (up from 70% in 2022), and full fibre / FTTP lines were at 57% (up from 42%).

5G mobile is now available from at least one mobile network operator in approximately 85-93% of UK premises (which is up from 67-78% in 2022). 

What Were the Top 50 Fastest Countries for Broadband in 2023?

During 2023, across the world we have seen a continued improvement in fixed and mobile broadband speeds.

Unfortunately, despite big improvements in the UK in terms of full fibre and 5G coverage, we are still quite low down on the rankings compared with other countries who are seemingly able to improve their real-world performance at a faster (or at least similar) pace. 

What’s the issue we’re facing in the UK? It could be partly down to the take-up of full fibre and gigabit-capable broadband lines in the UK. We are still in quite an early phase of adoption – Typically it takes 2-3 year for growth and adoption to stabilise for new networks. 

You might be interested in what country came top for fastest download speeds for fixed line and mobile broadband. The tables and charts below illustrate the ranking of the top 50 fastest countries in the world for fixed and mobile broadband. 

Fastest 50 Countries for Fixed Broadband Speed (DL) in 2023
Country (2023)MbpsCountry (2022)Mbps
Singapore264.15Singapore219.57
Hong Kong (SAR)263.07Chile219.34
Chile248.65China203.5
United Arab Emirates235.72Hong Kong (SAR)198.24
China230.39Thailand196.46
Thailand218.94United States182.63
United States215.72Denmark174.67
Denmark206.8United Arab Emirates166.53
Iceland204.8Japan165.53
France200.99Macau (SAR)159.8
Romania191.36Spain157.31
Spain189.37Romania155.07
Monaco187.49Switzerland143.46
Switzerland187.48Monaco142.03
Netherlands177.88France139.73
Japan170.29New Zealand134.19
Canada165.67Canada127.54
New Zealand163.16Hungary119.36
Macau (SAR)160.52Taiwan119.03
Taiwan157.55Liechtenstein118.07
Andorra156.9Netherlands117.74
Kuwait153.58Portugal116.57
Liechtenstein152.22Andorra115.39
Portugal150.45Panama110.96
Hungary149.85Kuwait110.07
Panama148.76Norway106.3
Israel144.81Moldova105.22
Uruguay143.06Sweden105.01
South Korea139.83South Korea99.87
Brazil136.92Uruguay97.48
Poland133.35Brazil95.95
Sweden127.33Poland95.59
Qatar127.04Israel95.54
Norway123.63Luxembourg93.95
Luxembourg117.66Finland93.79
Colombia111.65Malta92.27
Malaysia110.8Lithuania91.5
Jordan109.58Malaysia90.24
Moldova108.2Saint Lucia87.67
Malta108.19Qatar87.33
Vietnam104.08Colombia87.24
Lithuania103.26Belgium85.31
Finland102.43Saudi Arabia85.1
Saudi Arabia102.41Trinidad and Tobago82.94
Trinidad and Tobago100.68Barbados81.92
Saint Lucia99.96Dominica79.83
Ireland94.62Vietnam78.87
Peru93.52Slovenia78.81
Barbados92.96Germany77.34
Philippines91.08Saint Vincent and the Grenadines76.86
Country (2023)MbpsCountry (2022)Mbps
United Arab Emirates269.41United Arab Emirates138.82
Qatar206.8Norway129.81
Kuwait191.74Qatar126.03
China164.14South Korea125.17
Macau (SAR)155.75China113.5
Norway146.02Netherlands109.45
South Korea145.25Denmark109.29
Denmark143.63Bulgaria106.88
Bulgaria142.07Kuwait102.73
Iceland139.52Saudi Arabia97.81
Netherlands119.34Brunei97.37
Saudi Arabia106.01Australia87.76
United States103.69Luxembourg83.14
Australia97.44Switzerland82.91
Bahrain97.19Bahrain82.67
Sweden97.07Sweden82.1
Finland95.48Finland76.27
Croatia89.51Canada74.77
Singapore89.45Croatia74.35
Switzerland89.45Singapore74.19
Canada87.85Macau (SAR)73.67
Luxembourg85.76North Macedonia73.62
Brunei85.13United States72.34
Lithuania84.8Lithuania67.1
France82.6Cyprus66.33
North Macedonia81.98Taiwan65.93
Austria78.92New Zealand63.15
India75.86Portugal62.19
Taiwan75.77Austria61.25
Portugal75.71Hong Kong (SAR)61.12
Greece72.45Maldives61.09
New Zealand72.32Greece60.57
Estonia72.07France60.54
Hong Kong (SAR)69.59Belgium59.68
Belgium68.54Estonia58.59
Maldives67.59Montenegro57.36
Cyprus67.37Germany57.27
Malaysia66.84Slovenia54.3
Oman66.02Malta50.68
Uruguay66Oman50.03
Germany64.74Serbia47.78
Latvia64.42Suriname46.09
Malta61.03Latvia45.99
Slovenia60.52United Kingdom45.57
Czechia56.11Slovakia43.95
Montenegro53.16Iran42.95
Serbia52.41Japan42.93
Romania50.95Czechia42.24
Albania50.06Hungary42.11
Brazil47.98Romania40.62
Performance Categories (Download)20232022
UK Country Rank for Fixed Line56th56th
Global Latency – Fixed Line9ms10ms
Global Upload – Fixed Line40.45Mbps31.16Mbps
Global Download – Fixed Line87.79Mbps72.40Mbps
UK Latency – Fixed Line13ms14ms
UK Upload – Fixed Line24.58Mbps18.55Mbps
UK Download – Fixed Line84.93Mbps69.76Mbps
Performance Categories (Upload)20232022
UK Country Rank for Mobile51st44th
Global Latency – Mobile27ms28ms
Global Upload – Mobile11.03Mbps9.05Mbps
Global Download – Mobile48.47Mbps33.43Mbps
UK Latency – Mobile34ms36ms
UK Upload – Mobile7.24Mbps7.33Mbps
UK Download – Mobile47.65Mbps45.57Mbps
Which Is The Best Mobile Network for 4G/5G in the UK 2023?

Opensignal, the leading global provider of independent insight and data into network experience and market performance, last week published their latest report on Mobile Network Experience for the second half of this calendar year.

Their reports and insights are the independent global standard for understanding the true state of the world’s communications networks based on measurements of real user experience. 

The Mobile Network Experience Report is based on crowdsourced data (the process of obtaining data from a large number of sources in order to generate insights). It was gathered from users on hundreds of thousands of devices, including smartphones. 

Data was collected between the 1st June and the 29th August 2023. This latest report looks at mobile broadband services (4G and 5G) from the 4 primary UK mobile operators and how they compared across various categories. The operators are:

  • EE
  • Vodafone
  • O2
  • Three UK

Which network delivered the best mobile broadband performance? 

Overall, the best networks seemed to be EE and Three UK. 

In this study, it mostly looked at the combined performance of 3G, 4G and 5G networks. However, it did look at some 5G connections individually. 

In 1st Place

The most awards went to EE. They won 7 of the categories, and came joint top on 3 others. This is slightly less than last year, when they won 8 categories and came joint top in 5. 

In 2nd Place 

Three UK took 2nd place, which matches their top performance in other studies for availability and download and upload speeds on 5G. 

They also came joint top for 5G Video Experience and 5G Live Video Experience. 

The Winners by Category

You can see which of the various categories were won by which network in the infographic below. 

You can see that O2 were the bottom of the pile with just one award, which was joint with all 3 of the other networks for 5G Availability. 

Vodafone had just one award (for Voice App Experience) along with 4 joint winnings for Video Experience, 5G Video Experience, 5G Live Video Experience and 5G Availability. 

Opensignal-uk-mobileawards-H2-2023

With thanks to Opensignal for the graphic detailing the categories and winners. 

Download Speed Experience – All Mobile Connections

NetworkDownload Speed H2 (Mbps)Download Speed H1 (Mbps)
EE4047.7
Three UK34.535.4
Vodafone2725
O220.919.3

Download Speeds – 5G

NetworkDownload Speed H2 (Mbps)Download Speed H1 (Mbps)
Three UK205.5237.7
Vodafone114.3100.6
EE99.5122.3
O27775

Upload Speed Experience – All Mobile Connections

NetworkUpload Speed H2 (Mbps)Upload Speed H1 (Mbps)
EE9.39.8
Vodafone88.2
Three UK6.36.2
O25.15.1

Upload Speeds – 5G

NetworkUpload Speed H2 (Mbps)Upload Speed H1 (Mbps)
Three UK17.517.3
EE15.916.9
Vodafone14.914.9
O29.89.8

UK Availability % – All Mobile Connections

Network% UK Availability H2% UK Availability H1
Three UK99.199
EE98.598.3
Vodafone97.597.3
O297.397

UK Availability % – 5G

Network% UK Availability H2% UK Availability H1
EE10.69.8
Three UK10.310.6
O210.18
Vodafone109.7

Summary

You’ll see from the data above that performance leaders EE and Three UK have actually lost some of their download speed in comparison with the first half of the year (H1). For EE, this meant a drop from 2nd to 3rd place in the 5G download performance category.

The availability of 5G performance (measured using the % of time spent on a 5G connection) improved across all networks with O2 delivering the biggest overall increase despite being near the bottom for the majority of categories. 

Unfortunately, it would seem that their merger with Virgin Media (VMO2) hasn’t shown to have had much of an impact on performance as they remain the lowest rated mobile operator across most of the categories which remained a common trend over recent years.

It’s good to note that as with most pieces of research, studies of this nature do have their limitations. The data set, as mentioned above, was crowdsourced meaning that this app-based data can be affected by various limitations and factors such as the location of the device and the various plans being used on those devices. 

It also doesn’t allow a solid baseline as there are no common bases across hardware and environment. 

So remember that collected data and testing performance in this way may not always give a complete picture. However, Opensignal are one of the more reliable organisations when it comes to analysing data such as this. 

Which mobile network operator are you with – And would you agree with the results? 

Have 5G Download Speeds Fallen in Your Region?

Global leader in network intelligence and connectivity insights, Ookla have revealed via their Speedtest.net platform that 5G based mobile broadband download speeds have fallen over the past year in most UK regions. 

However, despite this fall in 5G download speeds, the overall data speeds for both 4G and 5G have increased. 

Speedtest.net from Ookla is a popular testing service for broadband and mobile network performance. This latest research is based on data collected between the second quarter of 2022 and 2023. 

It found that overall, users have seen a mild increase in their download speed in 10 out of 12 UK regions, across all types of mobile broadband combined.

The highest increase was by 23.4% in the North East, with the lowest increase being in the Yorkshire and Humberside region at 3.9%. (There were a couple of exceptions where the changes were too small to be of note in the South West and Northern Ireland). 

5G Download Speeds Show Statistically Significant Decline

When the study looked at just the data for 5G download speeds, it became apparent that 9 out of 12 UK regions had users with a statistically significant decline. 

3 of these regions experienced a decline of more than 20% in 5G download speeds with another region closely behind:

  • Northern Ireland – 21.65%
  • East Midlands – 21%
  • South East – 20.7%
  • Yorkshire and Humber – 17.8%
Ookla-5G-Speeds-by-UK-Region-Q2-2022-to-2023
With thanks to Open Signal for the graphics

What Can Cause a Decline in 5G Download Speeds?

Typically, we might see a decline like this due to a combination of network maturity and rising customer take-up. Over time, this can cause network congestion, putting pressure on capacity. 

Thankfully, we can combat these issues with technological advances. For example, Ofcom’s future plans are to release more 5G spectrum. We can also benefit from the evolution of 5G technology, such as Standalone 5G. Future improvements like this will help with issues causing declining 5G download speeds. 

How Much Time Do People Spend With an Active 4G/5G Connection?

Ookla research has also found that the proportion of time users spent with an active 4G/5G connection has increased. With the improvements we’ve seen recently with coverage, coupled with the gradual shutdown of 3G (with 2G to follow).

The biggest increase of time spent actively connected to 4G/5G was in Wales (a rise of 4.5%). The smallest increase was 2.4% which was in Yorkshire and Humber. 

Time Spent With Active 5G Connection Also on the Rise

Unsurprisingly, the time users spend with an active 5G connection is also increasing with 5G availability on the rise. 

London – 4% increase (The largest increase of 5G availability)

East Midlands – 3.2%

Eastern – 3%

Wales – 2%

As we already mentioned, this increase in the availability of 5G could explain the decline in 5G download speeds. This is because there are more users than before all trying to use the same data and spectrum capacity. 

However, some regions didn’t see a statistically significant change:

  • Scotland
  • Northern Ireland
  • North East
  • South West
  • West Midlands
Ookla-5G-Availability-by-UK-Region-Q2-2022-to-2023

Which networks were people connected to 4G/5G most?

The data can be further analysed for each network. 

EE – 97.2% (an increase of 2.7% over the last year)

Three – 94% (a larger increase from 85.2% which was the largest of all operators)

Vodafone – 93.2% (an increase of 5%)

O2 – 90.1% (increased from 86.8%)

Which network are you on? Have you noticed any changes with 4G or 5G download speeds in your region?